

The 360 Degree Forex Indicator
The Opportunity
Trading the strongest currencies against the weakest currencies is the biggest edge that exceptional Forex traders have over average Forex traders. Those type of trades provide the strongest trends.
The Problems
No Charts
There are no charts for the US Dollar on its own (or any other currency for that matter) – you have to compare the USD with something else to get a feel for the strength or weakness of the currency.
By looking at the EURUSD you can get a feel of whether the US Dollar is stronger or weaker than the EUR. This is a narrow view as the EUR itself could be very strong or very weak so you are only getting information on the EUR compared to the US Dollar.
The Confusion
What makes this comparison even more confusing is that different time periods will give you different perspectives. The EUR could be stronger than the Dollar on the monthly, 4hour, 15 minute charts and weaker on the weekly, daily, 1 hour, 30 minute, 5 minute and 1 minute charts. Pretty confusing isn’t it.
The Sheer volume of information
And that is only 1 cross, the EURUSD. Imagine trying to do it for the top 8 currencies crosses in all Time periods. You would have to look at 8 x 8 = 64 possible crosses. This amount can be halved as you don’t need to both the EURUSD and the USDEUR. But then you would have to look at 32 charts in each time period (Monthly, Weekly, Daily, 4 Hour, I Hour, 30 Minute, 15 minute, 5 minute and 1 minute charts) 32 x 7 = 224 constantly changing charts and readings.
Reduce confusion about which currencies to trade and in which direction and in which time-frame

Trade confidently using the best currencies and the the best direction. Reduce the guessing and taking chances. Know what's going on in the market with all currencies at a glance. HAVE A 360 DEGREE VIEW

The solution
THE 360 DEGREE INDICATOR. It calculates the strength of a currency compared to all its crosses on all time periods at the same time in pips. It then presents all this information in table formats. These tables sit on your charts and updated in real time – you always know the exact relative strength of a currency compared to other currencies in different time periods ALL the time.
It is ideal to trade the strongest currency against the weakest currency. When the currency cross consists of a strong currency/weak currency you should BUY. When the currency cross consist of a weak currency/strong currency then you should SELL.
TABLE 1
The basic relative strength readings over various periods ranging from 3 hours to 3 months as shown below. The figures in the blocks show by how many pips the currency has weakened or strengthened. The red blocks show weakened currencies and the green blocks show strengthened currencies:-
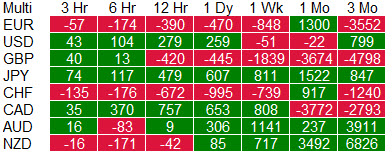
You will notice that relative strength is measured in time periods that are not in-line with chart timeframes. This way of measuring relative strength has evolved by user experience over the years and the time periods in place have been found to be informative. Relative strength using short term time frames( 1 minute, 5 minutes, 15 minutes, 1 hour etc.) have not been meaningful and often misleading. Relative strength trading is intended for longer term perspectives.
Examples of the kind of information you can get from this table are:
- The JPY has overall strengthened compared to other currencies over all measurement times (sign of a sustained strong currency)
- The CHF and the EUR, overall has weakened compared to other currencies over all measurement times, except for the 1 month period (sign of a sustained weak currency )
- In the last day the CHF has lost 995 pips overall compared to other currencies whereas the CAD has gained 653 pips overall compared to other currencies. With the benefit of hindsight buying the CADCHF would have been the best trade to make.
- You can also see trends in this table. The USD was strengthening in the short term whereas the EUR was weakening in the short term. Selling the EURUSD would have been a good move.
- Except for the 6 hour view the AUD has been in a strengthening trend.

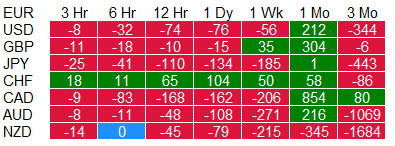
TABLE 2 You will see that the Total column in table 2 is the same as the total column in Table 1. Table 2 breaks the Currency Total column down into the various other currencies that make up the total column for a selected time period shown in the top left corner.
Just because the EUR lost 470 pips against other currencies you will see that it actually gained value compared to the CHF. This detail is important as when deciding to trade a particular currency cross. You can change the time period by clicking on the time period heading you want to view in Table 1
TABLE 3
Table 3 allows you to compare a particular currency with all other currencies and all other time periods. The EUR was specified in the above example as shown by the currency in the top left corner of the table.
Again you can see that the EUR row in table 2 in reflected as the 1 Day column in table 3 to give a different perspective.
You can change the currency by clicking on the currency you want to view in Table 1
How to make the entry decision
Most traders use indicators to take trading decisions. To watch the indicators on say 20 currencies in up to 6 timeframes would require you have 120 indicator charts open.
Again the 360 Degree indicator shows you the exact readings of more than 120 or more indicator charts in one simple table.
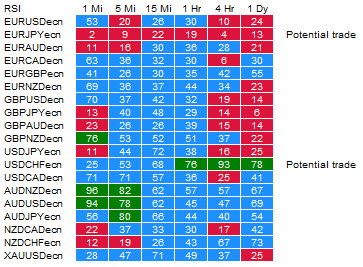
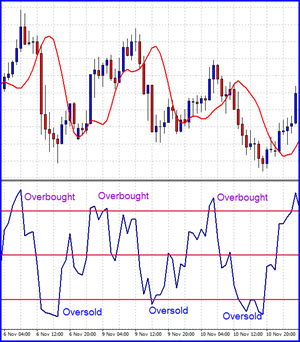
You can then use the indicator readings to identify overbought, oversold, sideways and trending currencies and enter according to your trading strategy.
Over bought readings are where the price has strengthened considerably and where reversals are more likely. Over sold readings are where the price has weakened considerably and where reversals are more likely.
When there are 3 or more oversold or overbought reading in a row there is a larger chance of the price reversing and the indicator gives a “Potential Trade” warning.
The Indicator allows you to specify the settings for each indicator
Potential trading approaches
1. A possible trading process when using the relative strength part of the 360 Degree Indicator
STEP 1: Use the indicator to identify the strong and weak currencies in your favourite time periods and formulate a trading strategy – e.g. to buy the strongest and sell the weakest.
STEP 2: Use the Multi-period Indicator to identify trading if there are any trading opportunities for the currencies identified in Step 1 when using your favourite indicator
STEP 3: View the chart of the currency you want to trade to confirm your decision and place your trade using an EA or a manual approach.
.
2. The possible trading process using the multiple time frame part of the 360 Degree Indicator.
STEP 1: Find overbought, oversold, trending currency trading opportunities from the multiple time frame Indicator table.
STEP 2: Check your trade identified to see if you are trading a strong currency against a weak currency.
STEP 3: View the chart of the currency you want to trade to confirm your decision and place your trade using an EA or a manual approach.
.
3. The possible trading process using ANY trading technique.
STEP 1: Find a potential Forex trade using ANY method.
STEP 2: Check your trade identified to see if you are trading a strong currency against a weak currency or if there are conflicting indicator signals
STEP 3: View the chart of the currency you want to trade to confirm your decision and place your trade using an EA or a manual approach..
USING THE CURRENCY STRENGTH INFORMATION
There are 2 types of Forex traders.
- The "With the trend" trader who believes that unless there is compelling information to the contrary things will continue as the currently are. Trending currency crosses will continue to trend and strong currencies will continue to become stronger. They enter with the trend and buy strong currencies.
- Then there are contrarian Forex traders who believe that the price of a currency cross will eventually encounter support or resistance, new information or that the force driving the price in a certain direction will run out of steam and reverse. They trade the reversal of trends, weakening of strong currencies and strengthening of weak currencies.
Both these 2 groups of traders benefit from knowing which are the strongest and which currencies are the weakest currencies.
The trend trader will Buy strong currencies and sell weak ones. The contrarian trader will look for opportunities where strong currencies reverse or weak ones strengthen.
In order to enter trades the trader will use the trading charts using support and resistance or indicator signals.
The currency strength information supplies the valuable information about which currencies are the best to trade and more importantly which ones not to trade.
"After checking my negative trades last week I found that 90% of them were caused by me selling strong currencies and/ or buying weak currencies. I can't believe how stupid my trading had become because I was too lazy to check my trades against the trends created by strong and weak currencies. It is so easy to fall into bad habits without noticing it. I thought the market was just out to get me. Now I can trade with much more confidence." - Tony (New Zealand)

The 360 Degree Indicator has had a major upgrade !!
.
We have added 4 new indicators
You can now monitor the RSI, MA, CCI, MACD, ADX, STOCHASTIC, Bollinger Bands and the ATR
.
We have added Alerts
You can now be alerted via Email, Notifications, Push Notifications and sound Notification when your trading signals activate
View more details of these changes in this video
See these changes in the input and EA displays
The input section is very easy and gives total flexiblity

View on the trading screen when using the complete version. The indicator only needs to be loaded on one/any trading screen and it will work for all currencies.


We are currently running a special promotion where you can buy most of our trading Expert Advisors for 78% discount.
Click here >> 78% off <<
How to download this indicator.
The 360 Degree indicator provides essential trading information for Forex Traders who are trading manual or automated Forex Strategies. It does not trade for you and is not a continuously traded EA at all. The indicator is in EA format. It is a non-trading EA.
The 360 Degree Indicator is unlimited and will give you relative strength information on ALL currencies and time periods.
It also will provide multi Period readings for the MACD, RSI, CCI , MA, Stochastic, ADX, Bollinger Band and ATR in all time-frames (you can request other indicators to be added). You can download the complete version using the PayPal button for the special launch price of $88.00
Your purchase allows you to use the indicator on as many charts and as many times as you like as long as you do not use it more than 2 computers at the same time. Also included are free updates and support.
Existing clients who own an Expert4x EA or Indicator supplied by EAFactory can purchase the Complete version directly from the EAFactory website ( http://my.eafactory.com/expert4x ) at 50% discount
Buy Now Price $88
We also accept Bitcoin. Crypto prices are the same as PayPal and no further discounts apply.Please click on this link if you want to use this option BITCOIN
-
Forex Trading is dangerous and can result in a substantial loss of money. Due to the uncertain nature of the Forex market, there is no guarantee that our products will produce any favorable results. Before you purchase please read our RISK DISCLAIMER and SALE CONDITIONS at the bottom of this page.

-
 Does the currency strength EA/indicator use up a lot of CPU capacity in its calculations, across many currencies?
Yes, this is a very powerful indicator and uses above average amount of resources. It has to create history of most currency crosses to do a complete market analysis. Please allow a few minutes when using the indicator to do this when using it for the first time. Tips to deal with this is to only use your favourite currencies that you are actually going to trade at first. Also make sure your computer memory is always cleaned by deleting temporary internet files and rebooting regularly. A resource monitor is part of the indicator display.